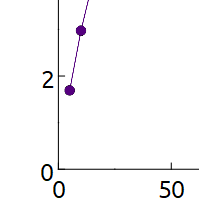
Hello!
I've been using LabPlot for a year aproximately and now I need to prepare some plots for a paper. However, I cannot find information on how to put just only one 0 in the axis intersection when both axis begin in 0. ¿Is there a way to erase one of them or to configure the plot so only one origin is shown?
Thank you
1 Comments
labplot@lemmy.kde.social · 1 pts · 1y
Hello!
Sorry for our late reply, we somehow missed your question. You need to set the offset for the first tick of e.g. the y-axis. Please, see the attached screenshot.