Hmmm I seem unable to zoom in on the picture on the Android lemme app so I can't see any of the numbers on the graph. Does anyone know how to get around this?
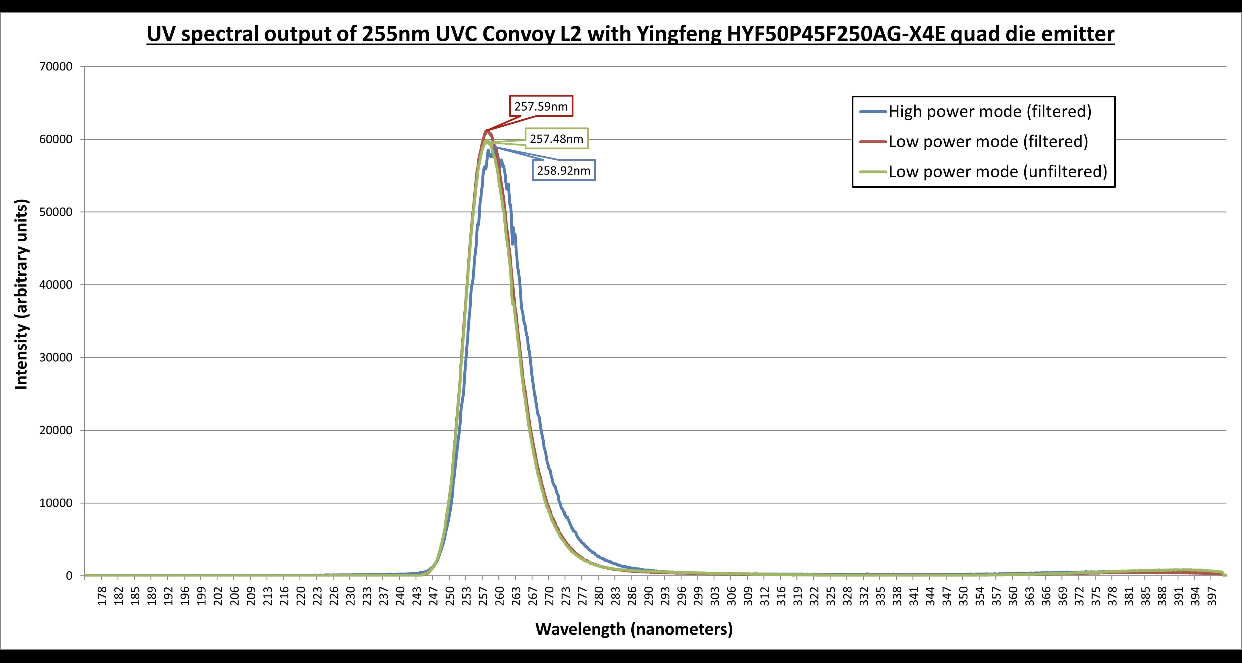
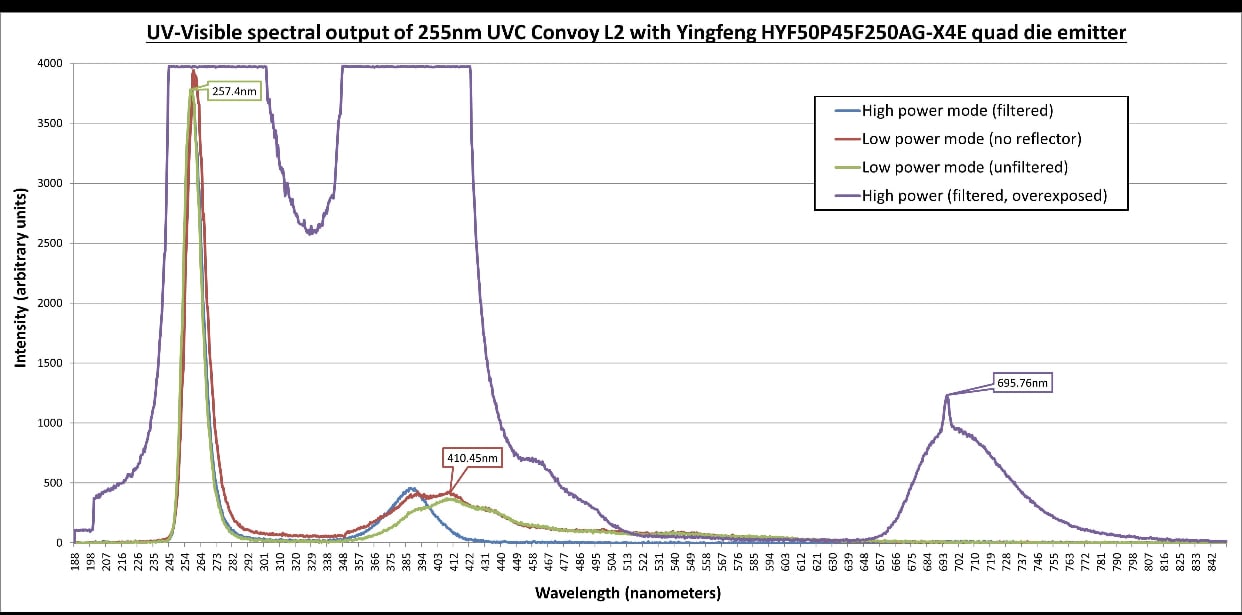
The first plot shows a single peak for all modes/filters, but the second plot shows the secondary peak at 395~405nm for the same emitter and modes. What's going on here?
The second is a zoom showing the minor secondary emission spectra, so there’s light around 400 and 675. It also shows the filter attenuates the 400+ light but doesn’t help with the <400 light so much.
7 Comments
Farmerbrightlight@lemmy.world · 2 pts · 3y
Hmmm I seem unable to zoom in on the picture on the Android lemme app so I can't see any of the numbers on the graph. Does anyone know how to get around this?
dmenezes@lemmy.world · 2 pts · 3y
What's "filtered"? After coming through a ZWB2 filter? or something else?
Sakowuf_Solutions@lemmy.world · 3 pts · 3y
Is the ZWB3 glass.
dmenezes@lemmy.world · 2 pts · 3y
Holy crap. I hadn't even heard of ZWB3 until now... :-)
Sakowuf_Solutions@lemmy.world · 1 pts · 3y
😂
Spicy3d@lemmy.world · 2 pts · 3y
What is the difference between these two plots?
The first plot shows a single peak for all modes/filters, but the second plot shows the secondary peak at 395~405nm for the same emitter and modes. What's going on here?
Sakowuf_Solutions@lemmy.world · 2 pts · 3y
The second is a zoom showing the minor secondary emission spectra, so there’s light around 400 and 675. It also shows the filter attenuates the 400+ light but doesn’t help with the <400 light so much.