Here's how you can profile the lemmy server cpu usage with perf (a standard linux tool):
Run this to record 10 s of CPU samples:
perf record -p $(pidof lemmy_server) --call-graph=lbr -a -- sleep 10
Then run this to show the output perf report.
Screenshot example:
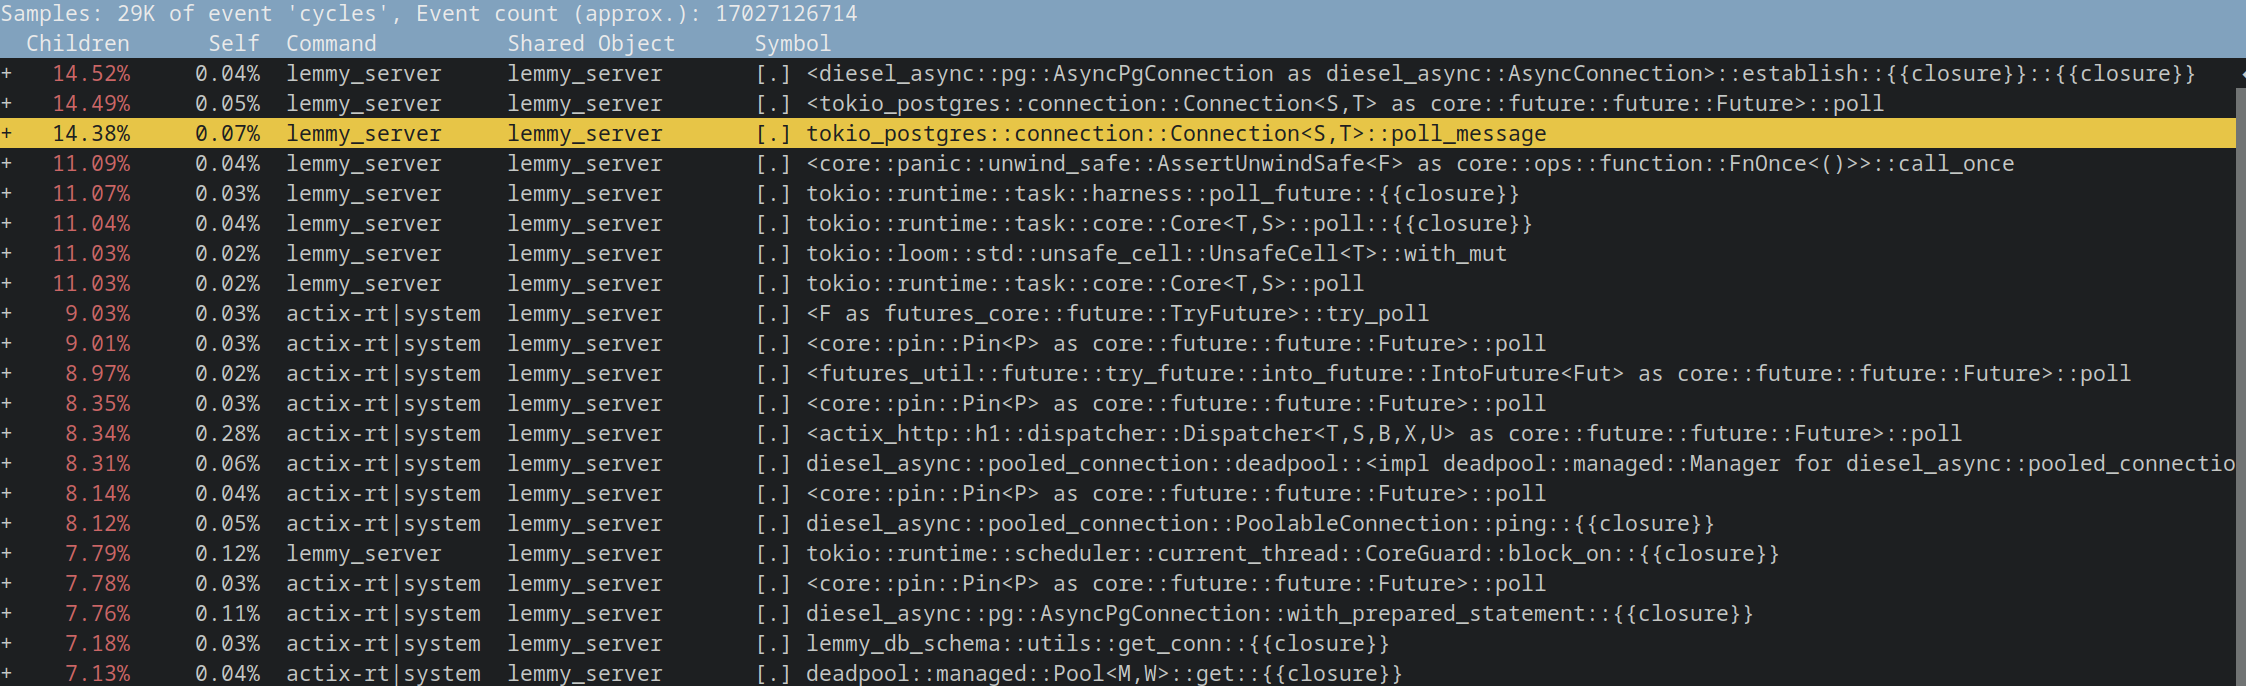
Post your result here. There might be something obvious causing high usage.
2 Comments
RoundSparrow@lemmy.ml · 1 pts · 3y
Thank you for sharing. Storage I/O tips?
The default Docker install, last time I looked IIRC, has rust logging cranked really high.
kbotc@lemmy.world · 1 pts · 3y
bcc-tools.